本页还没有译文
本页 6 段还没译成日本語,下面显示的是英文原文。Inspect memory usage using V8 heap snapshots
还没翻译译自英文(bun.com)本页 6 段都还没译
Bun implements V8's heap snapshot API. Use it to capture the heap at runtime and debug memory leaks in your JavaScript/TypeScript application.
import v8 from "node:v8";

// Creates a heap snapshot file with an auto-generated name
const snapshotPath = v8.writeHeapSnapshot();
console.log(`Heap snapshot written to: ${snapshotPath}`);
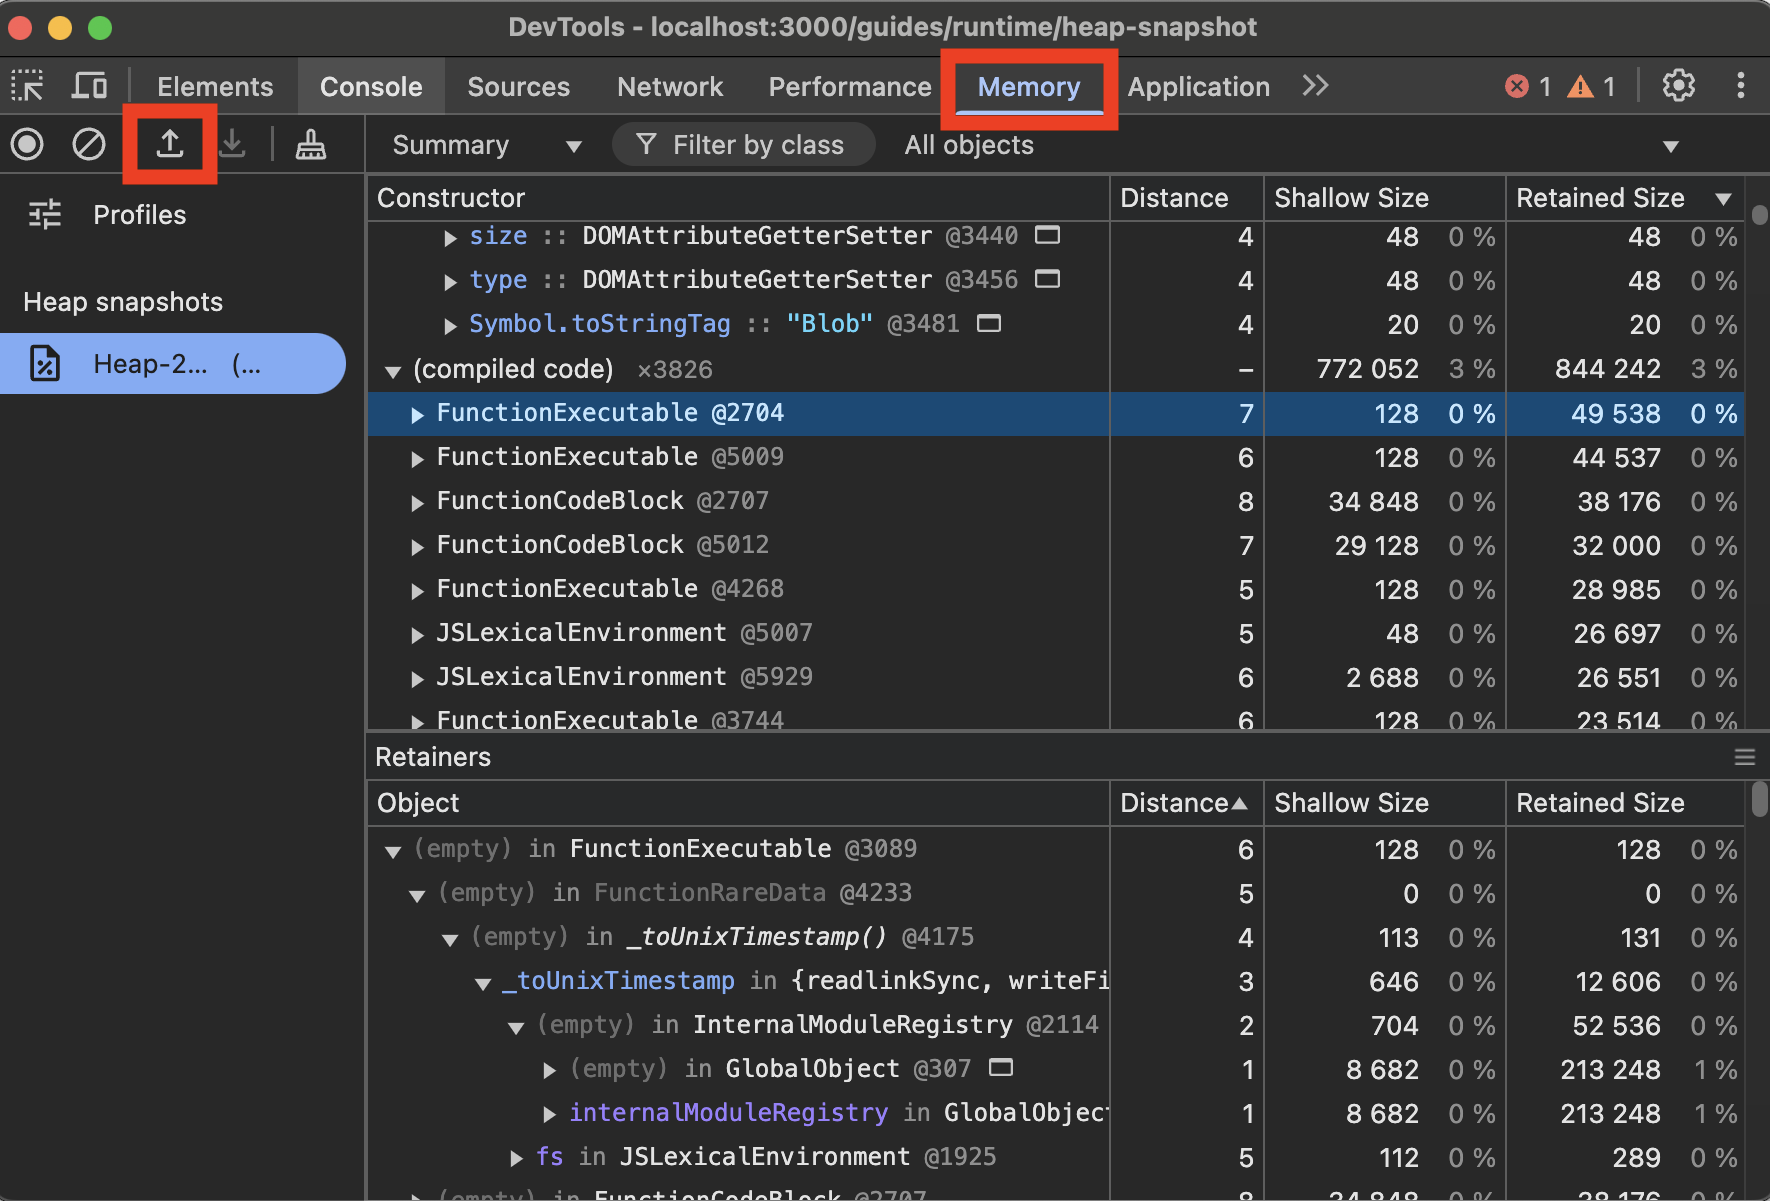
Inspect memory in Chrome DevTools
To view V8 heap snapshots in Chrome DevTools:
- Open Chrome DevTools (F12 or right-click and select "Inspect")
- Go to the "Memory" tab
- Click the "Load" button (folder icon)
- Select your
.heapsnapshotfile
AI 翻译查看英文原文